
Cost Per Diverse Hire: How to Calculate It and Lower It
October 1, 2026
Cost per diverse hire is the total cost of recruiting a group of candidates divided by the number of diverse hires you made from that group. The formula is simple. The hard part is deciding which costs belong in it and what the result means. Measure it by channel, pair it with retention, and put more of your budget into sourcing where diverse candidates already want to work. Done that way, the number tends to fall instead of rise.
This guide is for talent acquisition teams, HR leaders and diversity and inclusion owners. It is also for job seekers and allies who want to understand how employers count the cost of hiring them. It covers the formula, a worked example, U.S. benchmarks, the privacy rules that apply to the data, and practical ways to lower the figure. If you hire LGBTQ+ professionals, we show where a curated platform fits into the math.
Key Takeaways
- Cost per diverse hire = costs of recruiting the diverse hires in a period ÷ number of diverse hires in that period. Compare it with your overall cost per hire, never in isolation.
- SHRM’s 2025 benchmarking puts average cost per hire at $5,475 for nonexecutive roles and $35,879 for executive roles. No comparable official benchmark exists for diverse hires specifically, so your own history is the baseline.
- Count internal costs (recruiter and interviewer time, tools, employer branding) as well as external ones (job boards, agencies, events), or channels will look cheaper than they are.
- Collect demographic data only voluntarily and keep it separate from applications and away from decision makers.
- The fastest way to lower the figure is to shift spend to channels with a high share of qualified diverse candidates and to track quality and retention next to cost.
What cost per diverse hire means
Cost per hire tells you what it costs, on average, to bring one new person into the company. Cost per diverse hire applies the same arithmetic to a subset: the hires from groups you are trying to reach, such as women, people of color, people with disabilities, veterans or LGBTQ+ professionals. Which groups you count is your decision. It should match the goals you have set and the data candidates have chosen to share.
The point is comparison. If your overall cost per hire is $5,000 and your cost per diverse hire is $9,000, something in your sourcing is inefficient. It might be channels that do not reach these candidates, slow screening, or offers that fall through. If the figure is lower, you have found a pipeline worth expanding. A single number says little. A trend by channel, role and quarter says a lot.
The formula
The standard cost-per-hire formula, used in the SHRM/ANSI standard, is internal recruiting costs plus external recruiting costs, divided by total hires in the period. For diverse hiring, the same formula is applied to the group:
Cost per diverse hire = (internal costs + external costs attributed to diverse hires) ÷ number of diverse hires
A simpler version divides all hiring costs by the number of diverse hires. That version is easy to run but can mislead, because it charges the cost of every hire to a subset. The attributed version is more useful for decisions. It takes more tracking, and the effort pays off.
Which costs to count
Split costs into two buckets.
External costs are money paid to outside parties:
- Job board postings and sponsored listings
- Agency or search fees
- Career fairs, conferences and event sponsorships
- Advertising and employer branding campaigns
- Assessments and background checks
- Candidate travel and relocation
Internal costs are the company’s own resources:
- Recruiter, coordinator, hiring manager and interviewer time
- Applicant tracking system and sourcing software
- Referral bonuses
- Recruiter travel
- Employer branding work done in house
Staffing Industry Analysts makes a point that matters when you compare channels. Services cover different steps: a job board may leave résumé review and candidate replies to you, while a staffing firm may hand you a shortlist. A board that looks cheap on the invoice can cost more once your team’s screening hours are added. Put those hours in the formula.
If your goal is to compare against other organizations, consider a narrower “comparable” version that leaves out items such as relocation and sign-on bonuses. Workable’s recruiting metrics ebook describes this internal versus comparable split. For your own decisions, the full internal version is the honest one.
For college recruiting, the NACE cost-per-hire worksheet lists six categories: college relations and recruiting office costs, prerecruiting activities, recruiting trips, company visits, hiring and relocation costs, and advertising. It also warns that cost per hire alone says nothing about the quality of the hire. That caution applies to every version of this metric.
A worked example
The figures below are illustrative, not benchmarks. Say your company made 48 hires last year and spent $240,000 on recruiting. Overall cost per hire is $240,000 ÷ 48 = $5,000.
Of those hires, 12 came from the groups you track as diverse hires. You trace their costs:
| Cost item | Diverse hires (12) | Other hires (36) |
|---|---|---|
| External spend (boards, events, ads) | $48,000 | $96,000 |
| Internal time and tools (allocated) | $24,000 | $72,000 |
| Total | $72,000 | $168,000 |
| Cost per hire | $6,000 | $4,667 |
The diverse-hire figure is 29% higher than the rest ($6,000 against $4,667). That sounds like a problem, but the table does not tell you why. Break it down by channel:
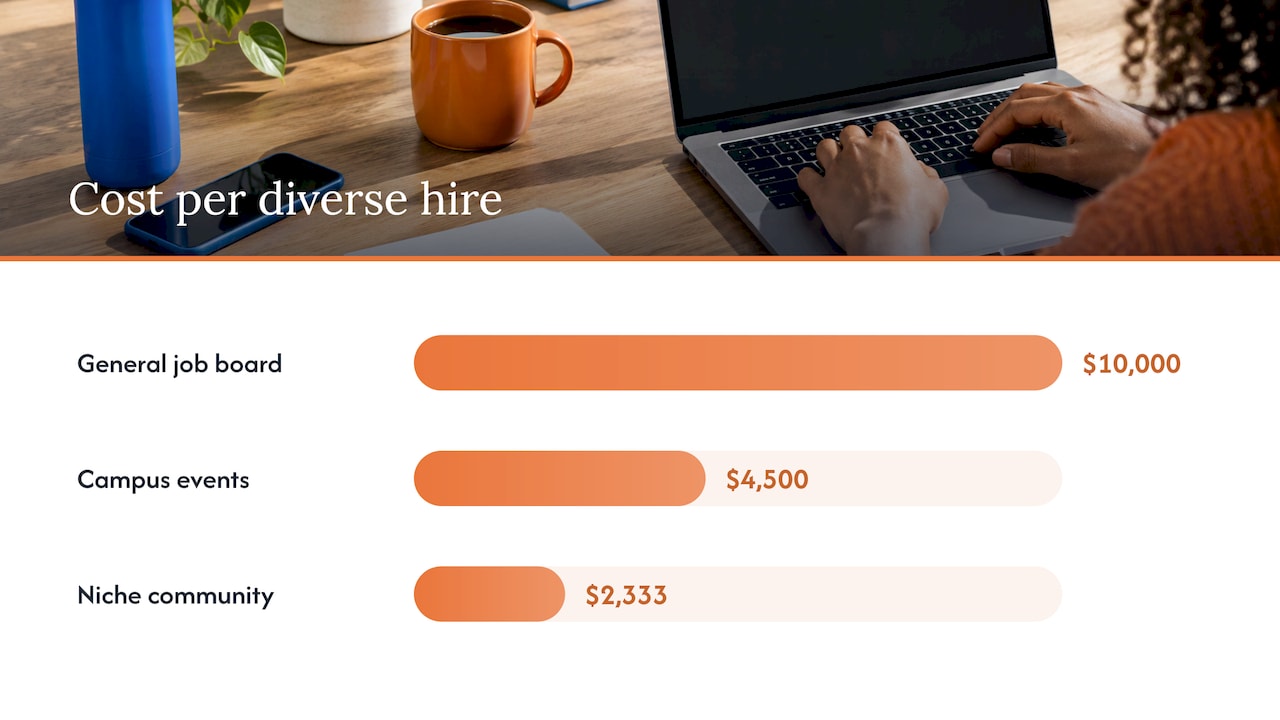
| Channel | Spend | Diverse hires | Cost per diverse hire |
|---|---|---|---|
| General job board | $20,000 | 2 | $10,000 |
| Campus events | $18,000 | 4 | $4,500 |
| Niche community platform | $14,000 | 6 | $2,333 |
This is what the analysis is for. In this example one channel is more than four times cheaper per diverse hire than another. You now know where to move budget. You would not see that from the blended $6,000.
One caution: small numbers are noisy. Two hires from one channel is a signal to watch, not proof. Track at least a few quarters before cutting anything.
What U.S. benchmarks say
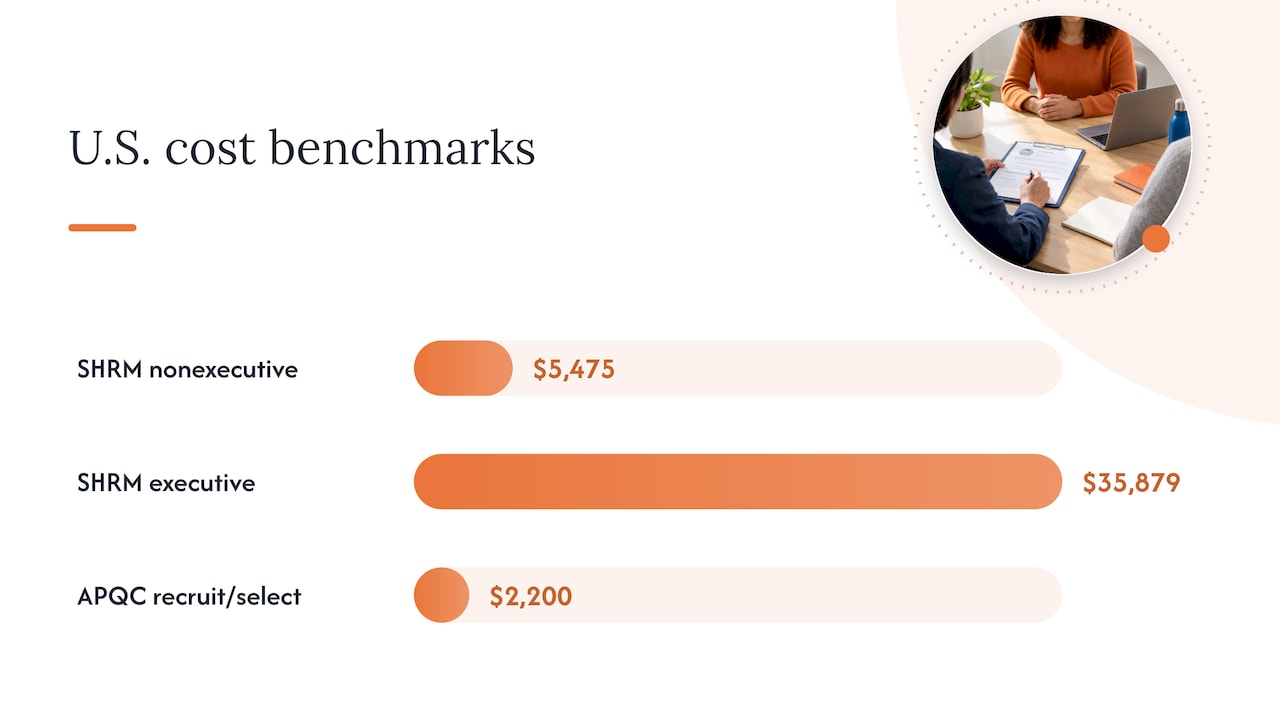
General benchmarks are easy to find. The 2025 SHRM Benchmarking Survey, with 2,371 member respondents, reports an average cost per hire of $5,475 for nonexecutive roles and $35,879 for executive roles. Executive hires cost nearly seven times as much. APQC measures something broader, the total cost of the recruit, source and select process per new hire, and reports a median of $2,200 across 2,342 companies. The two differ because they define costs differently, which is another reason to fix your own definition and stick to it.
A trustworthy, official benchmark for cost per diverse hire does not exist. Some vendor pages quote percentage premiums, but their sources and definitions vary, and we would not build a budget on them. Your best benchmark is your own overall cost per hire, measured the same way, and your own trend over time.
SHRM’s 2025 report also finds that only 20% of organizations track quality of hire. If you track it, you are ahead of most, and you can answer the question that cost alone cannot: are these hires staying and performing?
Why costs differ across roles and channels
Most variation comes from five factors:
- Seniority. Executive searches cost many times more than entry-level hiring, per SHRM’s figures above. Compare like with like.
- Channel mix. Agencies, boards, events and referrals have very different cost structures and different candidate pools.
- Screening effort. Manual review of high application volumes consumes recruiter hours that never show on an invoice.
- Process length. More interview rounds and slower decisions raise internal cost and lose candidates to faster offers.
- Employer brand. Candidates who already see your company as inclusive apply in greater numbers and accept offers more readily. That lowers the cost of each hire.
The fifth factor is why audience matters. For LGBTQ+ professionals, a generic posting on a large board does not show whether the workplace is safe to be out in. A listing on a platform where every employer has committed to inclusion answers that question before the candidate applies.
Measuring diversity responsibly
A cost-per-diverse-hire metric depends on demographic data, and that data carries legal and ethical obligations in the U.S.
- Keep it voluntary. An EEOC informal discussion letter explains that applicant data by race, sex and ethnic group must be maintained with safeguards, that questions should be voluntary, and that the information stays separate from job applications, confidential and away from the people making hiring decisions.
- Explain why you ask. Another EEOC letter says applicants should be told the identification is sought for federal recordkeeping, not for employment decisions, and that the forms should be kept apart from applications.
- Report in aggregate. Your analysis needs counts and averages, not names. Keep groups large enough that no individual can be identified.
- Handle sexual orientation and gender identity with extra care. Federal recordkeeping categories focus on race, sex and ethnicity, so an LGBTQ+ question is typically an optional, employer-designed self-identification. Make it clear that it is optional, who sees it and how it is used. If you are unsure how to set this up, ask your employment counsel before you launch it.
There is also a conceptual warning. In a 2003 article, John Sullivan raised the comparison of diverse and non-diverse hiring costs but cautioned against tracking it as a standalone diversity recruiting metric. We agree. A cost figure can push a team to favor cheap hires over right hires. Use it to find efficient channels, never to set a ceiling on what a diverse candidate is worth.
How to lower your cost per diverse hire
1. Move spend toward channels that already reach the candidates
The channel table above is the pattern to look for. Review every channel’s cost per diverse hire, and shift budget from the weakest to the strongest. Check that the channel produces candidates who stay, not just candidates who apply.
The evidence that diverse sourcing can pay for itself is real. The Upjohn Institute evaluated Per Scholas, a workforce nonprofit, as a recruiting source. It found its hires were 87% people of color, against 52% for other new hires, with quarterly separation rates 22% to 50% lower. Combining turnover and screening savings, the report estimated gains of $1,300 to $1,800 per employee per year. One pipeline, one study, so treat it as an example of the mechanism, not a guarantee. The mechanism is that targeted sourcing can reduce spend on repeated postings and cut turnover.
2. Widen the qualified pool
Forbes contributor Paolo Gaudiano argues that widening the pool of qualified candidates can increase supply and lower hiring costs, especially where competition for talent is strong. Rewrite job postings to list real requirements only, and review them for wording that discourages applicants. Our guides on diverse job postings for graduates and making recruitment trans-inclusive show what to change.
3. Shorten the process
Every extra interview stage and every week of silence adds internal cost and risks losing the candidate. Set a service level for each stage, use structured interviews with the same questions for every candidate, and tell candidates what happens next. Our LGBTQ+ recruitment workflow guide walks through the stages.
4. Build the employer brand where candidates look
Candidates from underrepresented groups often judge whether a company is safe before they judge the job. Visible commitments help: inclusive benefits, employee networks, and a profile on a platform they trust. If you are starting a program, see how to launch LGBTQ+ hiring initiatives and the overview of diversity recruiting strategies and benefits.
5. Track quality and retention beside cost
SHRM’s figures show most employers do not measure quality of hire. Add 12-month retention and first-year performance ratings to your dashboard, grouped the same way as your cost data. A channel with a higher cost per hire and much better retention can be the cheaper choice over two years. The recruitment cost is paid once, but the replacement cost repeats every time someone leaves.
Where a curated platform fits
If LGBTQ+ professionals are among the talent you want to reach, the channel you choose changes both sides of the formula: spend and hires. myGwork curates jobs and networking opportunities exclusively with corporations actively committed to LGBTQ+ inclusion. That means candidates arrive knowing the employer has made a commitment, and recruiters are not paying to reach a broad audience of whom few are the people they are trying to reach.
For employers, we offer plans from Essentials through Platinum, a GEO Employer Profile for employer branding, and services such as LGBTQ+ talent attraction, employer engagement, event promotion, branded newsletters and sponsored content. Pricing is not published, so you request details from our team. You can see the corporate solutions plans and the employer profile, or browse everything we offer for talent attraction.
If your team wants to improve retention as well as sourcing, our academy trainings on LGBTQ+ allyship in the workplace and intersectionality run in person or virtually.
Once you have a baseline from the worked example above, add the platform as its own line in your channel table. After a few quarters you will see what it costs per diverse hire next to your other channels, and what those hires do after the first year.
We hear the same worry from talent acquisition teams: diversity hiring sounds like it costs more. In our experience the cost comes from where the money goes, not from the people you want to hire.
When recruiters spread budget across broad channels and hope the right candidates find them, they pay for reach they do not need. When they put the budget where candidates have already chosen employers that stand behind inclusion, each dollar reaches the people they want.
That is why we built myGwork around employers committed to LGBTQ+ inclusion. Members get job listings, networking, mentorship and community in one place, and employers get a way to show who they are before the first application. Our own description of results includes helping organizations recruit thousands of candidates and reduce recruitment costs.
Measure your cost per diverse hire by channel, and keep the channels that give you the best candidates who stay. We think you will find a community-based channel on that list.
Adrien
FAQ
What is a good cost per diverse hire?
There is no official benchmark, so the useful comparison is your own cost per hire, measured the same way. SHRM’s 2025 figures of $5,475 for nonexecutive and $35,879 for executive roles are the general reference for all hires. A cost per diverse hire close to or below your overall figure suggests efficient sourcing, and a higher one tells you to examine channels, screening time and offer acceptance.
Should I include internal costs in the calculation?
Yes. The SHRM/ANSI formula adds internal and external costs. Internal costs include recruiter and interviewer time, tools and referral bonuses. Leaving them out makes self-service channels look cheaper than they are, because your team does the screening that an agency would otherwise do.
Is it legal to track diverse hires?
Employers commonly collect voluntary demographic data for recordkeeping and analysis. EEOC guidance says the information should be kept separate from applications, held confidentially and kept from those making selection decisions. For questions about your own program, such as how to ask about sexual orientation or gender identity, consult your employment counsel.
Can cost per diverse hire go down over time?
Yes. Moving spend to channels with a higher share of qualified diverse candidates, shortening the process and improving retention can all lower the figure. The Upjohn Institute’s evaluation of Per Scholas found lower turnover and screening savings from one diverse sourcing partner, which shows how targeted sourcing can reduce total cost.
Should I use cost per diverse hire as a target?
Use it to compare channels, not to cap spending on any group. A cost figure alone says nothing about quality, which is why NACE’s worksheet cautions against reading cost per hire by itself. Pair it with retention and performance.
Sources
- SHRM Releases 2025 Benchmarking Reports
- APQC: Total cost to perform the process group recruit, source, select employees
- NACE: How to Calculate Cost-Per-Hire
- Staffing Industry Analysts: Calculating the true cost of hiring
- EEOC Informal Discussion Letter (2008)
- EEOC Informal Discussion Letter (2003)
- ERE: Diversity Recruiting Metrics
- Upjohn Institute: Evaluation of Per Scholas as an Employee Recruiting Tool
- Forbes: 6 Ways Diversity And Inclusion Impact The Cost And Effectiveness Of Recruiting