
Diversity Candidate Pipeline Metrics: 2026 HR Playbook
July 28, 2026
Track a compact weekly set of diversity candidate pipeline metrics — applicant diversity ratio, source diversity ratio, stage pass-through rates by demographic, diverse-slate compliance, time-to-first-interview by demographic, offer-acceptance rate by demographic, and early retention rate by demographic — and you will find funnel leaks faster than any quarterly report ever could. The goal is simple: detect where underrepresented candidates drop off, run one targeted experiment to fix it, and measure the lift within four to eight weeks.
The minimal metric set to start this week:
- Applicant diversity ratio — what share of applicants come from underrepresented groups vs. the relevant labor market
- Source diversity ratio — which channels actually deliver diverse candidates into the funnel
- Stage pass-through rates by demographic — conversion at every stage (applied → screened → interviewed → offered → hired)
- Diverse-slate compliance rate — percentage of requisitions with two or more diverse finalists
- Time-to-first-interview by demographic — speed disparities that quietly filter out candidates with less schedule flexibility
- Offer-acceptance rate by demographic — a key outcome signal of inclusion and employer brand
- Early retention rate by demographic — confirms whether new hires from underrepresented groups are staying beyond the onboarding period
One person owns the weekly dashboard per role family. Before drawing conclusions from any demographic split, confirm you have at least 30 candidates in each group; below that threshold, aggregate into rolling three-month windows rather than weekly slices. Measuring DEI progress systematically is what separates teams that improve from teams that just report.
How to calculate each diversity candidate pipeline metric
The table below maps every core metric to its formula, the data fields your ATS needs to capture, a benchmark target, and the action lever to pull when the number goes wrong.

Formulas worth bookmarking
Applicant diversity ratio: (Underrepresented applicants ÷ Total applicants) × 100. Compare against Bureau of Labor Statistics occupational data for your geography and role family.

Adverse impact ratio: Selection rate of protected group ÷ Selection rate of highest-rate group. The EEOC’s four-fifths rule sets 0.80 as the legal threshold. A ratio of 0.75 means the protected group is selected at 75% the rate of the top group — that triggers a review.
Stage pass-through rate: (Diverse candidates advancing to next stage ÷ Diverse candidates at current stage) × 100. Run this separately for each demographic category and each funnel stage. A recruiting funnel analysis framework with open-source Power BI templates can accelerate dashboard build for analytics teams.
What the data usually reveals
When underrepresented candidates appear in your applicant pool but disappear at the screening or interview stage, the problem is almost never sourcing. It is assessment design and bias in the process itself. Fixing sourcing when the leak is at screening wastes budget and delays real improvement.
Diverse-slate compliance deserves its own emphasis. Research shows that having two diverse finalists on a slate dramatically increases the probability of a diverse hire — one diverse candidate barely shifts the outcome. A two-finalist policy, not a one-finalist policy, is the threshold worth enforcing.
On intersectionality: tracking race and gender separately misses compounding effects. When sample sizes permit (minimum 30 per cell), create combined categories such as “women of color” or “LGBTQ+ candidates of color.” Below that threshold, use rolling six-month windows rather than monthly slices to avoid drawing conclusions from noise.
Pro Tip: Time-to-first-interview by demographic is one of the most undertracked metrics in recruiting. Long gaps between application and first interview disproportionately exclude candidates with less schedule flexibility — caregivers, hourly workers, and candidates in time-sensitive job searches. A three-day median gap between demographic groups is a process design problem, not a candidate problem.
How to set realistic targets and benchmark your pipeline
The two most common benchmarking approaches are labor-market parity and internal baseline improvement. Neither is universally right; the choice depends on your role family, geography, and current funnel stage.
Labor-market parity compares your applicant pool or hire rate against the available workforce in your geography and occupation. BLS Occupational Employment and Wage Statistics and EEOC EEO-1 data are the primary U.S. benchmarks. If software engineers in your metro area are 28% women per BLS data and your applicant pool is 14% women, you have a 14-point sourcing gap worth closing.
Internal baseline improvement sets targets relative to your own prior-period performance. This works well when labor-market data is thin for a specific role or when your current representation is so far from parity that a parity target would be demotivating. A 5-point improvement per quarter is concrete and achievable.
Benchmark thresholds to use now
- Applicant diversity ratio: within 10 percentage points of the relevant labor market benchmark
- Stage pass-through disparity: no 20+ point gap between demographic groups at any single stage
- Adverse impact ratio: ≥ 0.80 (four-fifths rule) at every selection stage
- Interview-to-offer gap: no 15+ point disparity between groups
- Offer-acceptance gap: no 10+ point disparity between groups
- 90-day retention gap: no 15+ point disparity between cohorts
Sample-size guidance
Demographic splits become unreliable below 30 candidates per group. For roles with low hiring volume, use rolling three-month or six-month windows. For very small teams (fewer than 10 hires per quarter in a demographic group), report directional trends only and flag the low-confidence status explicitly on the dashboard. Never suppress the data entirely — just label it.
Pro Tip: Fix the stage before you fix the source. If your screen-to-interview pass-through rate shows a 25-point disparity for a demographic group, adding more sourcing channels will not help — those candidates will hit the same broken screen. Sequence your interventions: diagnose the stage, run the experiment, confirm the lift, then expand sourcing.
Data governance and legal considerations for U.S. demographic data
Collect voluntary self-ID with clear purpose, store it separately from the applicant profile, and limit access to authorized analysts. That is the legal and ethical baseline for any U.S. employer collecting demographic data in hiring.
Governance checklist
- Consent language: state clearly why you are collecting demographic data, how it will be used, and who will see it
- Voluntary disclosure: self-ID must be optional; provide a “prefer not to say” option for every category
- Separate storage: demographic self-ID data should not sit in the same record as interview scores or hiring decisions
- Controlled access: restrict demographic data to people-analytics and HR leadership; recruiters and hiring managers see only aggregated reports
- Retention policy: define how long demographic data is retained and align with your legal team on state-specific requirements
- Anonymized reporting thresholds: never publish a demographic split with fewer than five individuals in a cell; aggregate or suppress
EEOC and adverse impact
The EEOC’s Uniform Guidelines on Employee Selection Procedures require employers to evaluate whether selection procedures produce adverse impact against protected groups. The four-fifths rule (29 CFR 1607.4) is the audit threshold: if any protected group’s selection rate falls below 80% of the highest-rate group, adverse impact exists and the employer must either validate the selection procedure or discontinue it. Run this calculation at every selection stage — application, screen, interview, and offer — not just at the final hire decision.
Pro Tip: Add a short privacy notice to your careers page explaining that demographic questions are voluntary, used only for aggregate reporting, and never shared with hiring managers. Candidates who trust the process are more likely to self-identify, which improves your data quality and your ability to detect real disparities.
Common measurement pitfalls
- Inconsistent definitions across ATS fields: if “Hispanic” is coded differently in two requisition templates, your year-over-year comparison is meaningless. Standardize category definitions before you start tracking.
- Missing demographic fields: a 40% self-ID completion rate means 60% of your funnel is invisible. Investigate whether the self-ID prompt appears at the right moment in the application flow.
- Changing category mappings: when you update demographic categories (e.g., adding non-binary options), document the change date and do not compare pre- and post-change data as a continuous series.
- Over-tracking: a dashboard with 30 metrics and no owner produces no action. Keep the metric set small and review it consistently.
Turning pipeline metrics into experiments that produce results
A single weekly dashboard per role family, with one named owner and one experiment running at a time, produces better outcomes than a sprawling metrics library with no accountability. That is the operating model worth building toward.
Dashboard structure
Who owns what
- Recruiter: data collection accuracy (source tags, self-ID prompt placement), weekly dashboard review, experiment execution
- Hiring manager: diverse-slate compliance, structured-interview rubric adherence, calibration session participation
- People analytics: formula validation, rolling-window aggregation, adverse-impact testing, quarterly governance report
- ERG liaison: qualitative signal from community, candidate experience feedback, sourcing channel recommendations
Two experiment examples
Problem: Screen-to-interview pass-through rate for women is 18 points below the rate for men. Experiment: Replace the unstructured 15-minute phone screen with a 20-minute structured interview using a scored rubric. Assign two interviewers to each screen. Measure the pass-through rate for both groups over four weeks. Expected lift: Pass-through gap narrows to under 10 points within one hiring cycle.
Problem: Median time-to-first-interview for candidates who self-identify as having a disability is six days longer than for other groups. Experiment: Open three additional interview time bands per week and enable self-serve scheduling via calendar link in the application confirmation email. Measure median time-to-first-interview by demographic over four weeks. Expected lift: Median gap drops below two days.
Both experiments follow the same hypothesis frame: if we change [process element], then [metric] for [group] will improve by [amount] within [window]. Four to eight weeks is enough to see a directional signal for high-volume roles; low-volume roles may need a full quarter.
Measuring upstream activity from outreach through onboarding — rather than counting hires alone — is what makes these experiments detectable. A hire count tells you nothing about which stage the fix worked at.
How to choose the right metric set for your organization
Pick six to eight metrics across three categories — reach, speed and fairness, and outcomes — and review them weekly for each role family. That is the research-backed starting point. A compact dashboard tracking pass-through by stage, time-to-offer, offer acceptance, early retention, and candidate experience by demographic, reviewed weekly with one owner, produces measurable improvements. More metrics without more owners just produces more reports nobody acts on.
Recommended starting metric set
- Applicant diversity ratio (reach) — your leading indicator of sourcing health
- Source diversity ratio (reach) — tells you which channels to fund and which to cut
- Stage pass-through rate by demographic (fairness) — the most diagnostic metric in the set
- Diverse-slate compliance rate (fairness) — a process gate that directly affects hire probability
- Time-to-first-interview by demographic (speed) — reveals hidden process filters
- Offer-acceptance rate by demographic (outcomes) — employer-brand signal
- Early retention rate by demographic (outcomes) — confirms whether the hire was a real match, not a forced fit
- Adverse impact ratio (legal) — run monthly; flag anything below 0.80 immediately
One-week dashboard spec
- Minimum sample threshold per cell: 30 candidates; below that, use rolling three-month window
- Slice by: role family, geography, and hiring manager (where volume permits)
- Alert trigger: any stage pass-through disparity exceeding 20 points, or adverse impact ratio dropping below 0.80
- Weekly review time: 30 minutes, one owner, one experiment decision per session
Cadence checklist
- Daily: automated alerts for severe drops (adverse impact below 0.80, pass-through disparity above 25 points)
- Weekly: dashboard review, experiment status check, one new experiment decision
- Monthly: deep-dive on equity metrics (adverse impact, interview-to-offer, pay equity), source mix review
- Quarterly: governance review with ERGs, legal, and people analytics; update category definitions if needed; review intersectionality data with rolling windows
A note on intersectionality
When sample sizes permit, track combined demographic categories — women of color, LGBTQ+ candidates with disabilities — using six-month rolling windows. These compounding effects are often invisible in single-dimension reporting. A pass-through rate that looks equitable for women and equitable for people of color separately can still show a significant gap for women of color. Building an inclusive talent pipeline requires seeing those intersections, not averaging them away.
Process-health metrics — JD inclusivity scores, structured-interview utilization rates, panel diversity — are becoming primary signals precisely because they show whether the assessment itself is fair, not just whether the outcome looks diverse.
Key Takeaways
Tracking a compact set of diversity candidate pipeline metrics weekly, with one named owner per role family and one experiment running at a time, is the fastest path from data to equitable hiring outcomes.
Why compact weekly metrics beat quarterly vanity reporting
The most common failure mode in diversity hiring measurement is not a lack of data. It is a surplus of metrics with no owner and no experiment attached. Teams track 25 KPIs, produce a quarterly deck, and then wonder why nothing changes between slides.
The fix is almost embarrassingly simple: shrink the dashboard, name one owner, and run one experiment per week. Sapia.ai’s case work consistently shows that teams using a focused weekly dashboard — pass-through, time-to-offer, offer acceptance, early retention, candidate experience — outperform teams with comprehensive quarterly reporting. The cadence forces a decision. The quarterly report just documents what already happened.
Three traps to avoid. First, blaming sourcing when the data shows a screening problem. If underrepresented candidates are in your applicant pool and disappearing at the phone screen, no amount of new sourcing channels will fix that. Second, inconsistent definitions. If your ATS codes “Hispanic” differently across two job templates, your trend line is fiction. Third, over-tracking intersectionality before you have the sample size to support it. Tracking women of color as a combined category with 12 candidates in the window produces noise, not insight. Use rolling six-month windows and label low-confidence cells explicitly.
The practitioner rule of thumb worth keeping: if you cannot name the person who will act on a metric this week, remove it from the dashboard. Metrics without owners are decoration.
myGwork helps you source and measure LGBTQ+ talent in one place
For employers tracking source diversity as part of their pipeline metrics, myGwork is the direct route to LGBTQ+ talent that most sourcing mixes are missing entirely.
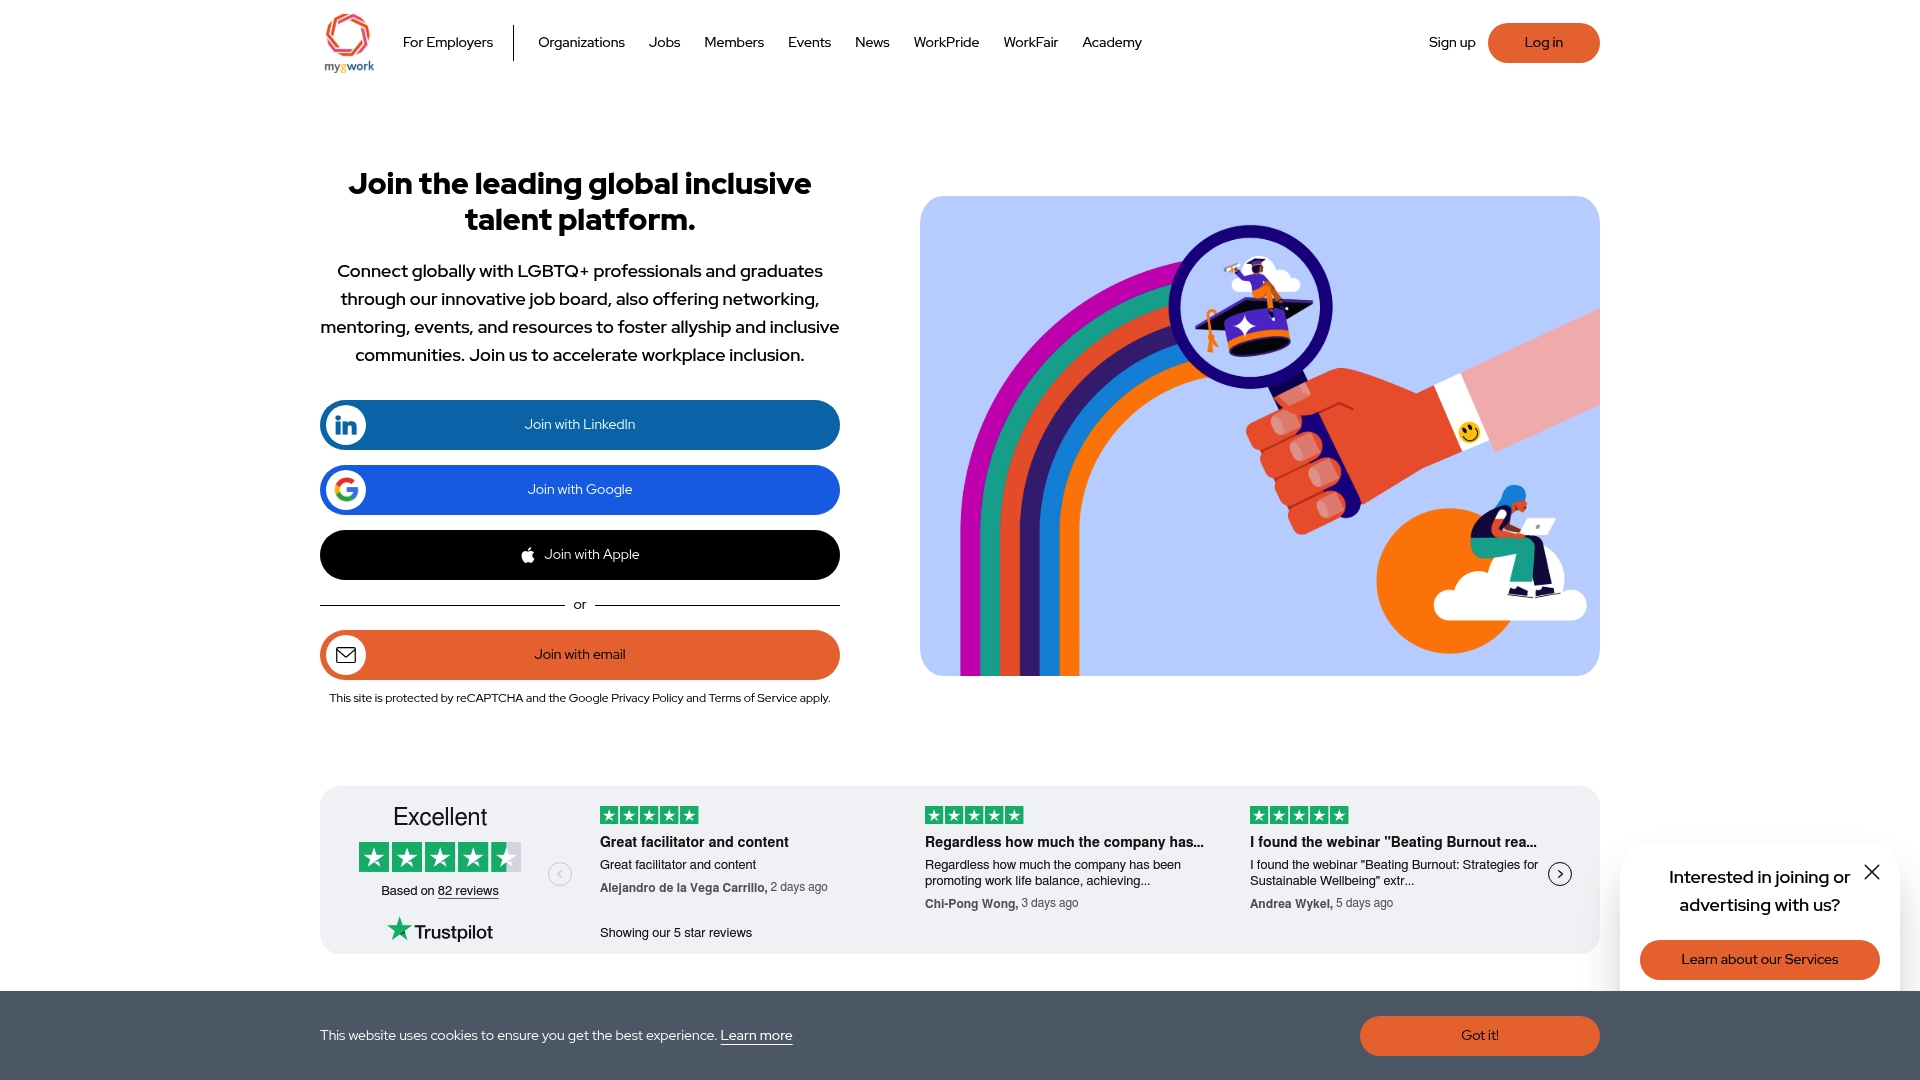
myGwork connects employers with a curated community of LGBTQ+ professionals and allies through LGBTQ±friendly job listings, employer-branding pages, mentorship programs, and community events. For talent acquisition teams running a weekly diversity dashboard, that means a taggable sourcing channel with measurable pass-through rates — not just a job board, but a signal you can track from application to offer. Employers can build an employer profile that communicates inclusion commitments directly to candidates, which addresses one of the most common causes of offer-decline gaps among LGBTQ+ talent: uncertainty about whether the workplace is actually safe. Visible LGBTQ+ leadership on your employer profile directly influences whether candidates accept your offer. Post your roles, build your brand, and track the results in the same dashboard you are already running. Visit myGwork.com to set up your employer profile and start measuring LGBTQ+ sourcing effectiveness this week.
Useful sources for practitioners
- EEOC.gov — primary authority on adverse impact, the four-fifths rule, and voluntary self-ID guidance for U.S. employers
- 29 CFR 1607.4 via Cornell Law — the exact regulatory text of the Uniform Guidelines on Employee Selection Procedures; use this when validating your adverse impact calculation
- EEOC EEO-1 Data — industry and occupation workforce composition data for setting labor-market parity benchmarks
- Sapia.ai: Diversity Recruiting Metrics — practical guidance on compact dashboards, weekly cadence, and case examples of pass-through improvement
- Gem: How to Measure Diversity in Hiring — upstream activity measurement from outreach to onboarding; useful for teams moving beyond hire counts
- SurveyMonkey: DEI Metrics — broader KPI list including eNPS, ERG participation, and retention metrics for teams building a fuller DEI program
- GitHub: Recruiting Funnel Analysis — open-source Power BI templates for stage conversion and diversity funnel visualization; useful for analytics teams building dashboards from scratch
- myGwork: Why Measure DEI Progress — rationale and recommended KPIs for organizations starting a DEI measurement program
- myGwork: Inclusive Talent Pipeline Guide — process-level guidance on building hiring workflows that support equitable outcomes